Impact
  • Getting started
  • Free Resources
    • Member request
    • Members
  • Research
    • Links
    • Further reading
  • IMPACT
    • reSolve Inquiries
  • About
    • Contact

Playing with positive and negative integers

24/9/2019

 
​One team of Year 6 teachers was interested in developing a Guided Inquiry for exploring positive and negative integers with their students. They wanted the inquiry to involve investigating everyday situations that use integers and to generate an authentic need for locating and representing these numbers on a number line (ACMNA125). What better way to engage students with learning about integers in Year 6, than with their inquiry, What is the best game that you can create to model positive and negative integers? If you would like to try this inquiry in your own classroom then please see the four phases of the 4D framework (Allmond, Wells & Makar, 2010) outlined below:
Picture
Discover
To start the inquiry, investigate the use of integers in everyday contexts. A game that includes positive and negative numbers on a number line (vertical or horizontal) can create an authentic context for modelling positive and negative numbers. You might like to consider the Elevator Challenge developed by re(Solve): Maths by Inquiry. Introduce the inquiry question and reflect on the challenge of the inquiry.
Picture
Devise
In this phase, have students collaborate to design their own games to model positive and negative integers. Guide the co-construction of a class set of criteria to define ‘best’ in this context. Use content from the Australian Curriculum and the Proficiencies described for Year 6 to inform this criteria e.g. the ‘best’ game needs to give players lots of chances to represent positive and negative numbers on a number line as well as opportunities to formulate and solve authentic problems involving positive and negative integers.  Encourage students to share their ideas and provide feedback on planning ideas. 
Picture
Develop
Provide time for students to make their games based on their planning and ideas in the previous phases. Have students play games other students have made to generate feedback on challenges to game designs, and on improvements and innovations that can be made. In this phase, have students prepare the mathematical evidence they will need to Defend their solution to the inquiry question.
Picture
Defend
Students now get to play the games designed by others and reflect to Defend how a game ‘best’ models positive and negative integers. Have students consider the mathematical evidence generated in games they play and focus learning on the many opportunities to problem solve as they play – locating and representing positive and negative integers on a number line. 
In all phases of the inquiry, Checkpoints can be used to share interim ideas and challenges. You can download the Authentic Problems Teachers’ Guide from the re(Solve): Maths by Inquiry website to find more information on this Guided Inquiry process. 
The Year 6 teachers who designed this unit were also interested in using the information about their students’ learning, generated through the inquiry, as summative assessment information. This assessment information would contribute to their current assessment schedule. The team here at Inquiry Maths Pedagogy in Action (IMPACT) worked with the Year 6 teachers to develop possible formative and summative assessment opportunities that could complement the Guided Inquiry, What is the best game that you can create to model positive and negative integers? (Now available from the Members section of this website). Part of this required the students to apply ideas gained from playing games with integers to an unfamiliar context to demonstrate transfer to cartesian planes. If you wish to use Our Marking Guide and suggested summative assessment questions in your own classroom, then you will need to ensure you do not explore games involving locating and representing positive and negative integers on a cartesian plane, such as in Battleships, prior to the assessment.
Picture
Our Marking Guide - ​available from the Members section of this website
If you decide to give this inquiry a try then we hope your class enjoys finding out What is the best game that you can create to model positive and negative numbers? You can use Our Marking Guide as well as the suggestions for assessment to generate assessable information about your students. We hope you find this useful and welcome your feedback (Contact).

Record Breaking

6/9/2019

 
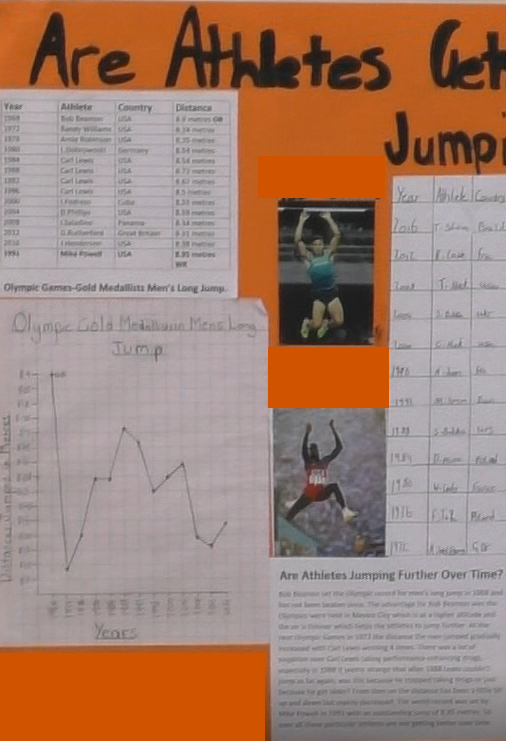
What mathematical problem solving could students participate in when engaged in the Guided Inquiry, Record Breaking: Are athletes getting better over time? The open-ended nature of this question lends itself to students devising multiple solution pathways as students consider the authenticity of the context. The ambiguity of the word ‘athletes’ means an answer depends upon whether students focus on women, men or children. Does getting ‘better’ mean faster, jumping higher/further, lifting more? Described in detail in the Record Breaking inquiry unit (Thinking Through Mathematics, Book 3, unit 8), adaptations for conducting the inquiry in different year levels – and alignment with the Australian Curriculum in each of these year levels – can be found below on this  Research Page  of the IMPACT website.
An article exploring this inquiry has recently been published in the Australian Primary Mathematics Classroom journal (Muir & Wells, 2019) and includes further illustrations of the mathematics in action in an Australian Year 5/6 classroom. These illustrations include different data displays typical of the work produced by students and exchanges made by students that include conclusions made in the Defend phase. 
​From the article:
Student's refined question: Are athletes getting better at jumping?
John: As you can see from my graph – and I did gold medals in men’s long jump – in 1968, George Beaman jumped 8.9 metres and that was the world record at the time and the reason for that was that it was in Mexico City and it has a high altitude and the oxygen’s thinner so you can jump further so from there it’s obviously gone down a lot [points to graph]. In 1972, it started to increase again [points to graph] and from then on it went a little bit up and down … in conclusion out of our four events, three are getting better at jumping (women and men’s pole vault, women’s triple jump) but not in the men’s long jump because it has to do with the places where the Olympics are being held. (Muir & Wells, 2019) 
Picture
​The Guided Inquiry approach provided students in Year 5/6 the opportunity to engage in authentic mathematical problem solving that required understanding of data representations, and fluency with interpretation, beyond simplistic representations. The reasoning by students (see the above example) required explanation of their analysis and evaluation of authentic data (about athletes) to justify conclusions reached in the Defend phase. 
​From Muir, T. & Wells, J. (2019). Are athletes getting better over time? Australian Primary Mathematics Classroom, 24(3), 15-20.

Does your class have a favourite type of book?

30/8/2019

 
Favourite Books: Does our class have a favourite type of book? is an inquiry that was published in Book 1 of the Thinking through Mathematics series. While the inquiry was originally designed for students aged 6-8 years of age, we have now aligned the mathematical intent of the inquiry with the Australian Curriculum: Mathematics. We think this inquiry would best suit exploration in a Year Three classroom but would also be good with Year Two or Year Four - the adaptations are provided below. Any childrens' book can be used to introduce the 'Maths Investigator' concept introduced in this unit.
Picture
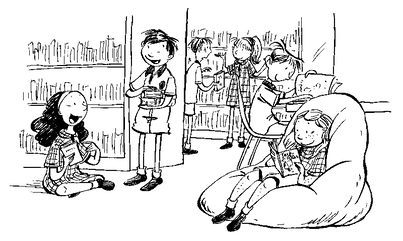
This unit provides an opportunity for children to share their love of reading. It also enables reluctant readers to discover the types of books their peers are reading and hopefully encourage them to read some of the suggested books. The nature of the data collection offers opportunities for a variety of data representations to be trialled and evaluated.
Year Three
Work together with the students to formulate question(s) to investigate from books you read together. Guide students to plan their data collection process and support students to choose their own ways to represent their data.
  • Identify questions or issues for categorical variables. Identify data sources and plan methods of data collection and recording. (ACMSP068)
  • Collect data, organise into categories and create displays using lists, tables, picture graphs and simple column graphs, with and without the use of digital technologies. (ACMSP069)
  • Interpret and compare data displays. (ACMSP070)
Year Four
Devise an everyday context that would necessitate the school librarian visiting the class to ask them to make decisions about favourite books. For example, a scenario that says Year Four have won the ‘Best Borrowers’ competition, which entitles the class to choose books for a library display. Invite the school librarian to share the context with the class and ask students: What are the best books to display, to represent our class? In Year Four, students can select and trial methods for data collection.  Remind students that graphs and tables are a way to help them understand and analyse the data as well as tools to communicate the answer. 
  • Select and trial methods for data collection, including survey questions and recording sheets. (ACMSP095)
  • Construct suitable data displays, with and without the use of digital technologies, from given or collected data. Include tables, column graphs and picture graphs where one picture can represent many data values. (ACMSP096)
  • Evaluate the effectiveness of different displays in illustrating data features including variability. (ACMSP097)
Picture
Picture
Picture
Year Two
The Favourite Books inquiry can be used to introduce younger students to the idea of sorting data into categories to identify categorical variables (using Venn diagrams and Carroll diagrams). Students could sort books by genre or topic for example.
  • Identify a question of interest based on one categorical variable. Gather data relevant to the question. (ACMSP048)
  • Collect, check and classify data. (ACMSP049)
  • Create displays of data using lists, table and picture graphs and interpret them. (ACMSP050)
If you are interested in trying this inquiry in your classroom, Favourite Books: Does our class have a favourite type of book?, download the inquiry unit from the Members section of this site for more detail. For more alignment information, including information about the Proficiencies, download the alignment document here.
We hope your students enjoy finding out which type of book is their class favourite.

Run a round robin handball competition

16/8/2019

 
Round Robin: Who is the best handball player in our class? is a great inquiry that you can find in book 2 of the Thinking Through Mathematics series. Designed initially for students aged 8-10 years, we have now aligned the mathematical content with the intent of the Australian Curriculum: Mathematics.
What happens in the inquiry?
​Handball is a popular, easy-to-learn schoolyard game which can be adapted for tournament use. ​This unit provides opportunities for students to explore triangular numbers and to apply their understanding to create an appropriate draw for their tournament. ​
Picture
Students:
  • Build on their existing knowledge of handball to design a round robin tournament draw. (Discover)
  • Plan and run a class handball tournament to decide the best player in the class. (Devise, Develop)
  • Use the data they generate to improve subsequent tournament designs. (Defend)
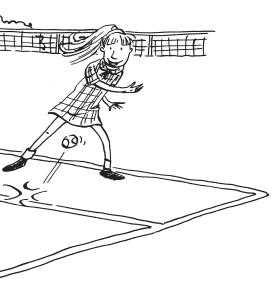
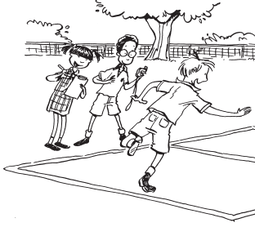
Year Six
Students determine the number of pools that might run in a competition, by drawing on their knowledge of triangular numbers. A handball tournament can be one way to identify triangular numbers and represent them using a real life context. 
  • Identify and describe properties of prime, composite, square and triangular numbers. (ACMNA122)
  • Interpret and use timetables. (ACMMG139)
Year Five
Students decide on an appropriate inquiry question that could be answered if the class conducted a tournament. As a class, have students decide how pool participants will be determined (random, seeded, etc.). Pool members can construct a workable draw and data collection sheet which includes match results and durations. 
  • Pose questions and collect categorical or numerical data by observation or survey. (ACMSP118)
  • Construct displays, including column graphs, dot plots and tables, appropriate for data type, with and without the use of digital technologies. (ACMSP119)
  • Describe and interpret different data sets in context. (ACMSP120)
Picture
Year Four
Students investigate how long a game is. Timekeeping (including timeouts) using a stopwatch or timer will be useful for students to get a feel for the duration of a game (e.g. 1:15 is one minute and 15 seconds or 75 seconds). Pools play and collect data for several (about six) matches following constructed draws. Students will need to organise and interpret data discussing frequency and range.
  • Convert between units of time. (ACMMG085)
  • Use ‘am’ and ‘pm’ notation and solve simple time problems. (ACMMG086) 
  • Select and trial methods for data collection, including survey questions and recording sheets. (ACMSP095) 
  • Construct suitable data displays, with and without the use of digital technologies, from given or collected data. Include tables, column graphs and picture graphs where one picture can represent many data values. (ACMSP096) 
  • Evaluate the effectiveness of different displays in illustrating data features including variability. (ACMSP097)
The full version of Round Robin: Who is the best handball player in our class? is available in the Members section of this site. For further information regarding alignment with the Australian Curriculum: Mathematics, including how the inquiry supports student development in each of the Proficiencies, please download the alignment document we have created.
​We hope you enjoy running a handball tournament in your classroom.

Record breaking in every year level!

10/7/2017

 
Picture
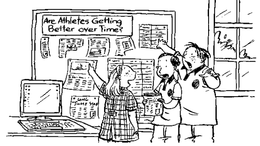
Record breaking is an inquiry unit you will find on the Resources page of this website. The inquiry can also be found in Book 3 of the Thinking through mathematics series, for students aged 10-13 years. An excellent way to mathematically consider records broken at the Olympic, Commonwealth, Paralympic, Pacific or Youth Olympics (depending on which is most relevant to your location and the year), in this inquiry students explore the notion that athletic ability has continued to improve over time. This is a popular classroom topic and such an inquiry could take place in many different year levels. The beauty of inquiry pedagogy is the ability to open tasks up so students of various abilities can successfully participate - low floor, high ceiling tasks.

Here we consideration, with a little imagination, ways in which you might adapt this unit for your own year level.
Foundation Year
Consider whether students can jump further from a standing jump or a frog jump. Direct comparison to determine which is longer.
Each student jumps. Records which jump was further (using markers to enable comparison) and then yes/no questions are asked to determine the most common response for the class.
  • Use direct and indirect comparisons to decide which is longer, heavier or holds more, and explain reasoning in everyday language (ACMMG006)
  • Answer yes/no questions to collect information and make simple inferences (ACMSP011)
Year One
Similar to above, but the students measure their jumps using informal objects. This provides an opportunity to discuss the need for uniform objects (imagine if you wanted to compare each other’s jumps). Count and record the jumps. How could we record the class data? What does the data mean? What would the data look like for other classes (inference).
  • Measure and compare the lengths and capacities of pairs of objects using uniform informal units (ACMMG019)
  • Recognise, model, read, write and order numbers to at least 100. Locate these numbers on a number line (ACMNA013)
  • Choose simple questions and gather responses and make simple inferences (ACMSP262)
    Represent data with objects and drawings where one object or drawing represents one data value. Describe the displays (ACMSP263)
Year Two
Consider whether students get better at jumping over time. Have the student record a jump. Practise jumping for a short period each day and then record the jump distance and weekly intervals. After three jumps (say three consecutive Mondays), students compare their jump data (you could use lengths of string/wool – blue for first jump, red for second, green for third etc). Did students jump further with practice? How can they record this data? What inferences can they make? 
Measure the string lengths with informal objects, how much further/less did the student jump from one jump to the next? Show your working (evidence).
  • Compare and order several shapes and objects based on length, area, volume and capacity using appropriate uniform informal units (ACMMG037)
  • Collect, check and classify data (ACMSP049)
  • Create displays of data using lists, table and picture graphs and interpret them (ACMSP050)
  • Solve simple addition and subtraction problems using a range of efficient mental and written strategies (ACMNA030)
Year Three
As Year 2, however the measurement are now able to be made in centimetres.
  • Measure, order and compare objects using familiar metric units of length, mass and capacity (ACMMG061)
  • Collect data, organise into categories and create displays using lists, tables, picture graphs and simple column graphs, with and without the use of digital technologies (ACMSP069)
  • Interpret and compare data displays (ACMSP070)
Year Four
As at Yr 3, with the additional connection between metric measures (metres and centimetres) and decimal place value notation. ie 123 cm is 1m 23cm. NB measurement should not be used to introduce decimal notation but only introduced once decimal PV is in place.
With this age group, consider the jumping events as these use length to two decimal places only (cm). Using timed events involves students with Base 60 and, if using hundredths (eg running or swimming) or thousandths of seconds (eg kayaking) – this can be quite difficult.
  • Use scaled instruments to measure and compare lengths, masses, capacities and temperatures (ACMMG084)
  • Recognise that the place value system can be extended to tenths and hundredths. Make connections between fractions and decimal notation (ACMNA079)
  • Select and trial methods for data collection, including survey questions and recording sheets (ACMSP095)
  • Construct suitable data displays, with and without the use of digital technologies, from given or collected data. Include tables, column graphs and picture graphs where one picture can represent many data values (ACMSP096)
  • Evaluate the effectiveness of different displays in illustrating data features including variability (ACMSP097)
Year Five
Intended year level of document. Be very careful of using events as cautioned in Year 4 notes).
  • Choose appropriate units of measurement for length, area, volume, capacity and mass (ACMMG108)
  • Recognise that the place value system can be extended beyond hundredths (ACMNA104)
  • Compare, order and represent decimals (ACMNA105)
  • Pose questions and collect categorical or numerical data by observation or survey (ACMSP118)
  • Construct displays, including column graphs, dot plots and tables, appropriate for data type, with and without the use of digital technologies (ACMSP119)
  • Describe and interpret different data sets in context (ACMSP120)
Year Six
As Year 5 with the additional connection between metric measures (metres and centimetres) and decimal place value notation. ie 123 cm is 1m 23cm is 1.23m.
Opportunities to extend the maths for this age would include: average time, proportional reasoning (Is the 200m run in twice the time of the 100m etc).
  • Connect decimal representations to the metric system (ACMMG135)
  • Convert between common metric units of length, mass and capacity (ACMMG136)
  • Solve problems involving the comparison of lengths and areas using appropriate units (ACMMG137)
  • Multiply decimals by whole numbers and perform divisions by non-zero whole numbers where the results are terminating decimals, with and without digital technologies (ACMNA129)
  • Interpret and compare a range of data displays, including side-by-side column graphs for two categorical variables (ACMSP147)
At all levels where students are constructing data representations (graphs, tables, tallies etc) – there are multiple opportunities to compare these representations and discuss the relative merits of, for example, a stem and leaf plot with a line graph.
We hope you are able to adapt the inquiry,  Record Breaking: Are athletes getting better over time? , to your own year level.

    Archives

    September 2019
    August 2019
    June 2019
    April 2018
    July 2017

    Authors

    Katie Makar
    Jill Fielding-Wells
    Sue Allmond
    Kym Fry
    Judith Hillman
    Karen Huntly
    Debra McPhee

    Categories

    All
    Alignment
    Argumentation
    Australian Curriculum
    Checkpoints
    Culture
    Evidence
    Ill-structured Problems
    Intellectual Quality
    Measurement And Geometry
    Number And Algebra
    Proficiencies
    Research
    Statistics And Probability
    STEM

    RSS Feed

Picture
This work is licensed under the Creative Commons Attribution-NonCommercial-NoDerivatives 4.0 International License. 
To view a copy of this license, visit Creative Commons.
Picture
  • Getting started
  • Free Resources
    • Member request
    • Members
  • Research
    • Links
    • Further reading
  • IMPACT
    • reSolve Inquiries
  • About
    • Contact